Connecting to OTel Providers
This guide covers sending this app's telemetry — logs, traces, and metrics — to an OpenTelemetry (OTel) backend. It assumes the app is already running locally; see Getting Started first if it isn't.
Both exporters speak plain OTLP/HTTP, so any OTLP-compatible provider works — point an endpoint (and, if required, auth headers) at whichever one you pick in Step 2.
What gets exported
| Signal | Backend | Frontend |
|---|---|---|
| Logs | ✅ | ✅ |
| Traces | ✅ | — |
| Metrics | ✅ | — |
Backend and frontend are enabled and configured independently — see Step 1 for the env vars.
Backend
Server-side env vars (TELEMETRY_ENABLED, OTEL_*), read via
backend/src/utils/env.ts and wired up in
backend/src/utils/telemetry.ts.
- Logs: every
AppLoggercall is also emitted as an OTel log record (/v1/logs) via@opentelemetry/exporter-logs-otlp-http, alongside the existing console output. - Traces: a globally-registered
NodeTracerProvider, combined with@ai-sdk/otel'sOpenTelemetryintegration viaregisterTelemetry(), makes everystreamTextcall in@cesium-ai/server's agent loop (runAgent) emit GenAI-semantic-convention spans (invoke_agent→chat→execute_tool) to/v1/traceswith no per-call opt-in needed. - Metrics: a globally-registered
MeterProviderwith aPeriodicExportingMetricReader(default 60s interval) exports to/v1/metrics. The agent loop and codegen pipeline each record histograms viacreateServerMetrics/createCodegenMetrics:cesium_ai.chat.tokens.{input,output,total}andcesium_ai.chat.request.durationfor chat;cesium_ai.codegen.tokens.{input,output,total},cesium_ai.codegen.skill_match.score, andcesium_ai.codegen.generation.durationfor codegen. Token usage uses a separate histogram per type so a dashboard's default per-metric graph is unambiguous — see Reading the token/duration histograms.
Frontend
- Build-time Vite env vars:
VITE_TELEMETRY_ENABLED,VITE_OTEL_*. - Read via
frontend/src/utils/config.tsand baked into the client bundle at build time (seefrontend/Dockerfilebuild args /compose.yaml). - Emits logs only (no client-side tracer) — from the chat panel and the codegen sandbox logger adapter.
Step 1 — Learn the common configuration shape
| Concern | Backend var | Frontend var |
|---|---|---|
| Enable export | TELEMETRY_ENABLED |
VITE_TELEMETRY_ENABLED |
| Base OTLP endpoint | OTEL_EXPORTER_OTLP_ENDPOINT |
VITE_OTEL_EXPORTER_OTLP_ENDPOINT |
| Explicit logs endpoint | OTEL_EXPORTER_OTLP_LOGS_ENDPOINT |
VITE_OTEL_EXPORTER_OTLP_LOGS_ENDPOINT |
| Explicit traces endpoint | OTEL_EXPORTER_OTLP_TRACES_ENDPOINT |
— (frontend emits no traces) |
| Explicit metrics endpoint | OTEL_EXPORTER_OTLP_METRICS_ENDPOINT |
— (frontend emits no metrics) |
| Auth/routing headers | OTEL_EXPORTER_OTLP_HEADERS |
VITE_OTEL_EXPORTER_OTLP_HEADERS |
service.name |
OTEL_SERVICE_NAME |
VITE_OTEL_SERVICE_NAME |
service.namespace |
OTEL_SERVICE_NAMESPACE |
VITE_OTEL_SERVICE_NAMESPACE |
| Extra resource attrs | OTEL_RESOURCE_ATTRIBUTES |
VITE_OTEL_RESOURCE_ATTRIBUTES |
| Log severity threshold | OTEL_LOG_LEVEL (default info) |
VITE_OTEL_LOG_LEVEL (default debug in dev, silent in prod) |
- Headers use the same comma-separated
key=value,key2=value2format for both sides, shared by logs, traces, and metrics on the backend (OTLPLogExporter,OTLPTraceExporter, andOTLPMetricExporterall readOTEL_EXPORTER_OTLP_HEADERS). - If an explicit per-signal endpoint var is unset, the app appends
/v1/logs,/v1/traces, or/v1/metricsto the base endpoint automatically — set an explicit endpoint only when a provider's ingestion path differs from that convention. - Frontend vars are build-time: changing them requires a
npm run devrestart or Docker rebuild (docker compose up --build), since Vite bakes them into the client bundle. - Set backend vars in the repo-root
.env(consumed bynpm run dev:backend/ thebackendcontainer) and frontend vars in the same file (consumed bynpm run dev:frontend/ thefrontendbuild args incompose.yaml). The sections below give per-provider.envsnippets.
Step 2 — Send telemetry somewhere
Pick one of the two options below.
Option A: Aspire Dashboard (recommended for local testing)
The Aspire Dashboard is the easiest way to see this app's telemetry locally:
- One container, a built-in OTLP endpoint.
- A UI with a trace viewer (for the
invoke_agent/chat/execute_toolspan tree), a structured log viewer, and a Metrics tab. - No cloud account or separate tool needed for logs vs. traces vs. metrics.
Frontend CORS note: unlike the backend (a server-to-server Node request, not subject to CORS),
the frontend sends OTLP logs directly from the browser via fetch.
- The dashboard rejects cross-origin OTLP requests by default. Without
DASHBOARD__OTLP__CORS__ALLOWEDORIGINSset to the frontend's dev origin, those requests silently fail (a blocked/failed POST to/v1/logsin DevTools' Network tab) and only backend telemetry shows up, even though both sides are configured identically. DASHBOARD__OTLP__CORS__ALLOWEDHEADERSis also required, since the browser exporter's preflight requestscontent-typebut the dashboard's default only allowsX-Requested-With.- If logs are still missing, check the preflight
OPTIONSresponse'sAccess-Control-Allow-Headersvalue in DevTools.
docker run --rm -d -p 18888:18888 -p 4318:18890 --name aspire-dashboard `
  -e DASHBOARD__OTLP__CORS__ALLOWEDORIGINS=http://localhost:5173 `
  -e DASHBOARD__OTLP__CORS__ALLOWEDHEADERS="*" `
  mcr.microsoft.com/dotnet/aspire-dashboard:latest
Use the following command to get the login token:
$loginLine =  docker container logs aspire-dashboard | Select-String "login\?t="
$matches = [regex]::Match($loginLine, "(?<=login\?t=)(\S+)")
$matches.Value | Set-Clipboard
echo $matches.Value
.env:
TELEMETRY_ENABLED=true
OTEL_EXPORTER_OTLP_ENDPOINT=http://localhost:4318

VITE_TELEMETRY_ENABLED=true
VITE_OTEL_EXPORTER_OTLP_ENDPOINT=http://localhost:4318
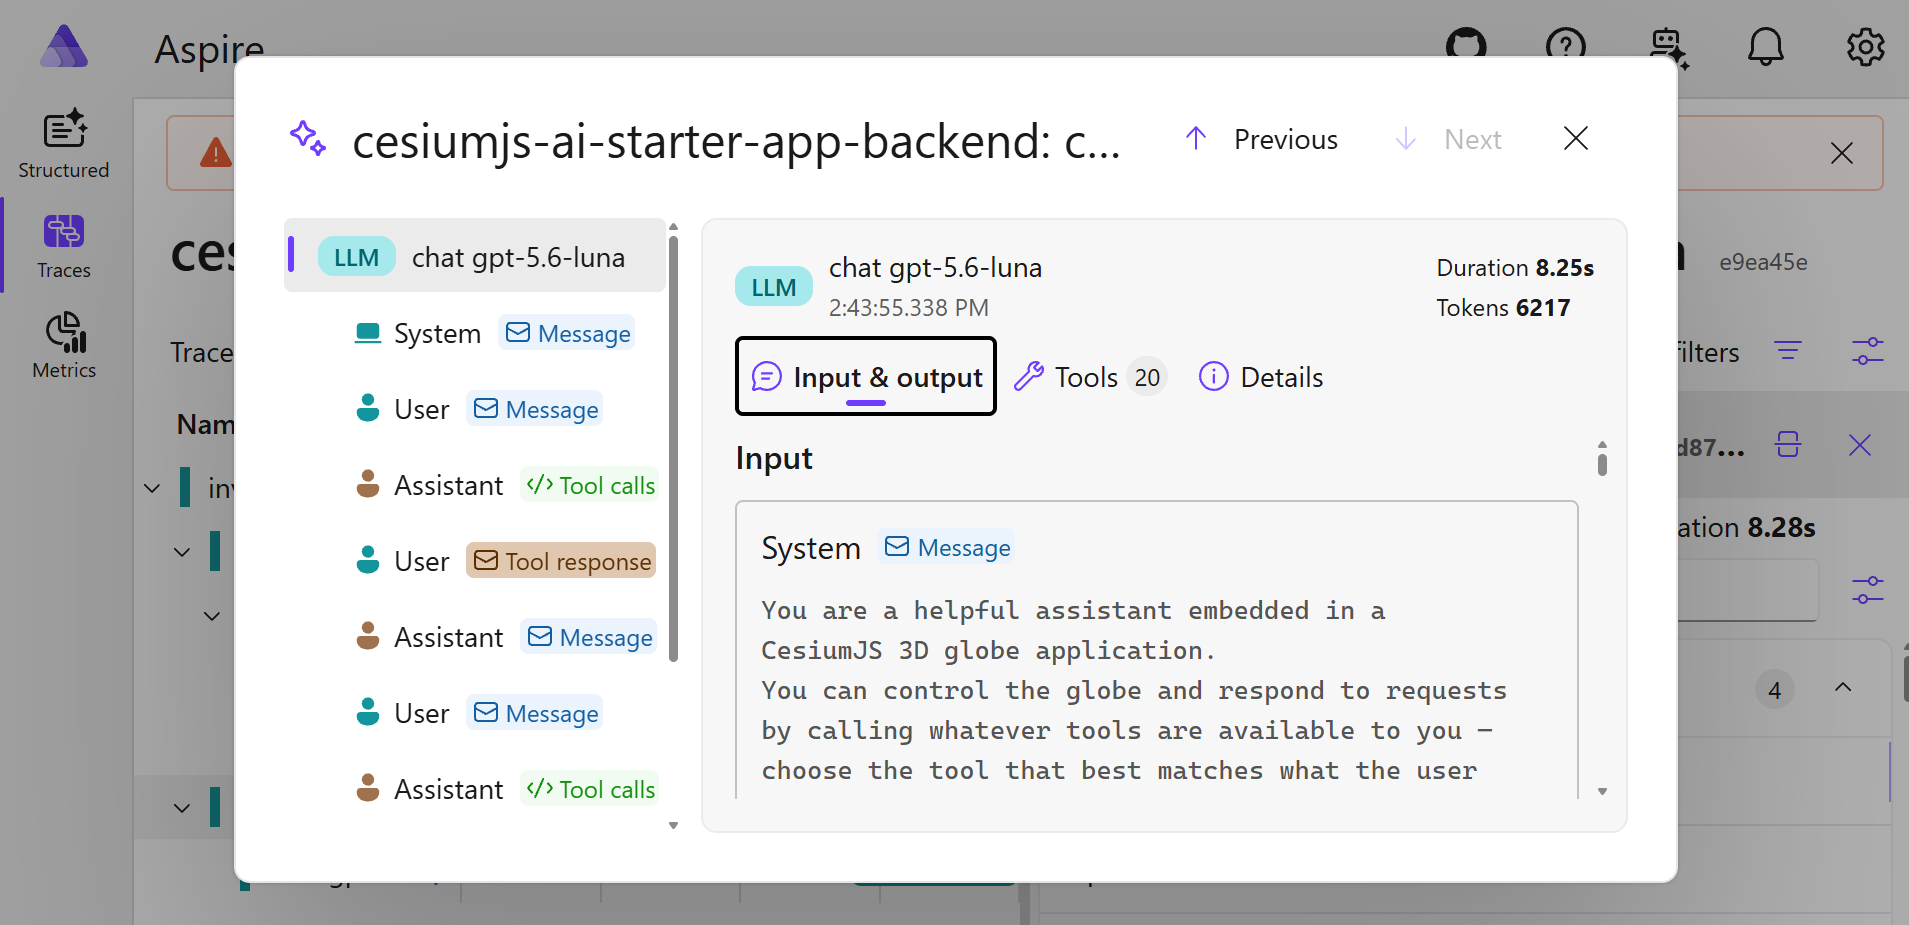
Open http://localhost:18888, send a chat message that triggers a tool call, then check Traces
for the invoke_agent span tree, Structured logs for the corresponding AppLogger output, and
Metrics for the cesium_ai.chat.tokens.*/cesium_ai.chat.request.duration histograms (metrics
export on the default 60s interval, so allow a minute for the first data point to appear).
Reading the token/duration histograms
- The Aspire Dashboard's Metrics tab renders one graph per instrument name, so
cesium_ai.chat.tokens.input,.output, and.totaleach show up as their own graph — view the.inputand.outputgraphs side by side to compare them. - Each line on a histogram graph (P50/P90/P99) is a percentile computed from the histogram's fixed bucket boundaries, not the exact recorded values.
- OTel's default bucket boundaries (
0, 5, 10, ..., 10000, tuned for millisecond latencies) put nearly every real token count into the same last bucket, collapsing P50/P90/P99 toward the same number regardless of actual usage. backend/src/utils/telemetry.ts'sMETRIC_VIEWSoverrides the bucket boundaries for everycesium_ai.*.tokens.*andcesium_ai.*.durationinstrument with ranges sized for this app's actual usage, so the percentile lines spread out meaningfully — add a matching entry there for any new token- or duration-shaped histogram.
Option B: OTel Collector (local, any backend)
- Run a local OpenTelemetry Collector to receive OTLP and fan it out to whatever backend you already use (Loki/Elasticsearch for logs, Tempo/Jaeger for traces, a cloud vendor, etc.), instead of pointing this app directly at each provider.
- Prefer this over the Aspire Dashboard when you need to test the shape of data reaching a particular downstream exporter rather than just eyeballing spans and logs.
# otel-collector-config.yaml
receivers:
  otlp:
    protocols:
      http:
        endpoint: 0.0.0.0:4318
exporters:
  debug:
    verbosity: detailed
  # add your real backend's exporter(s) here (loki, otlphttp/<vendor>, etc.)
service:
  pipelines:
    logs:
      receivers: [otlp]
      exporters: [debug]
    traces:
      receivers: [otlp]
      exporters: [debug]
    metrics:
      receivers: [otlp]
      exporters: [debug]
docker run --rm -p 4318:4318 -v ${PWD}/otel-collector-config.yaml:/etc/otelcol/config.yaml \
  otel/opentelemetry-collector:latest
.env:
TELEMETRY_ENABLED=true
OTEL_EXPORTER_OTLP_ENDPOINT=http://localhost:4318

VITE_TELEMETRY_ENABLED=true
VITE_OTEL_EXPORTER_OTLP_ENDPOINT=http://localhost:4318
Step 3 — Verify export
- Set
TELEMETRY_ENABLED=true/VITE_TELEMETRY_ENABLED=trueplus the endpoint (and headers, if required) for your chosen provider in the repo-root.env. - Restart the backend (
tsx watchonly reloads on.tschanges, not.env) and rebuild the frontend if you changedVITE_*vars (npm run dev:frontendordocker compose up --build). - Send a chat message that triggers at least one tool call (e.g. ask it to fly somewhere, or run
executeCesiumCode), then check your backend's ingestion UI, or the collector'sdebugexporter stdout, for: - Log records with
service.namematchingOTEL_SERVICE_NAME/VITE_OTEL_SERVICE_NAME. - A trace with a root
invoke_agent {modelId}span, nestedchat {modelId}spans (one per model round-trip) andexecute_tool {toolName}spans (one per tool call) — backend only. - Metric data points for
cesium_ai.chat.tokens.*andcesium_ai.chat.request.duration(and, forexecuteCesiumCodecalls,cesium_ai.codegen.*) — backend only; these export on a 60s interval, so allow a minute after the request before checking. - See the
README.mdenvironment variable table and.env.examplefor the full, authoritative list of telemetry vars.